CDC
I worked with the CDC over the course of a year to design
and develop both an Android and iOS application that would allow CDC field workers to remotely report hours, lab data, and other essential outbreak data.

Outbreak
Costing Tool
Tools utilized: Adobe XD, Illustrator, Photoshop, XCode & Swift, Android Studio & Java
1
About the CDC
The Center for Disease Control and Prevention is the US agency that is tasked with tracking and investigating public health trends and crises. Whenever a new micro-organism related outbreak starts to propagate throughout the United States, the CDC is the agency that is in charge of sending individuals and resources to infected areas to gather data about the spread of the infection and potential ways to mitigate the threat. For my Junior Design project, I worked with a team of five Georgia Tech undergraduate students to tackle a specific problem that the CDC was facing in terms of their outbreak data collection and aggregation.
Problem Space
2
Before our work on this project, the CDC field workers and lab researchers would have to fill out all their outbreak data and cost information into an outdated Excel spreadsheet that was then emailed to the administrator and later compiled with a script. This archaic system did not allow for real-time updates about outbreak costs or information and would be extremely cumbersome for CDC workers that were constantly on the go.

3
Design Process
Before deciding on the specific solution that we would implement, we wanted to do user research into the actual CDC workers and their daily workflow. We interviewed lab technicians, field workers, and administrators from the Denver Outbreak team and isolated two distinct user groups that would each have their own distinct application and solution space.

4
Users & Solutions
1. The first user group identified was the general outbreak workers, which included lab technicians, epidemiologists, field workers, and other non- administrative positions.
Since these individuals looked at various low-level aspects of the outbreak and would simply need to report their various data points to a higher authority for compilation and analysis, we decided on the solution of a mobile application that would mirror the original excel spreadsheet in terms of categories of data entry.
2. The second user group was the administrators that would oversee the overall statistics of the outbreak and observe progress and investigation from a high-level.
Since these administrators worked at discrete workstations and would have to make sense of a lot of data at once, we decided on the solution of a website application that would utilize a dashboard-style interface to quickly show important aggregate statistics on various outbreaks that were occurring.
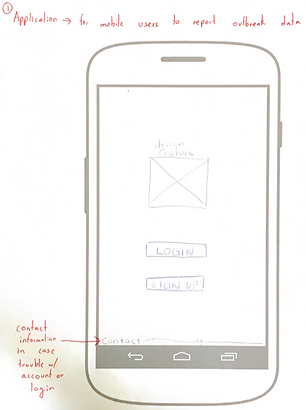
Paper Prototypes
5
When designing the outbreak worker mobile application, we used the original Excel spreadsheet as a template to replicate the various categories for data entry. We mocked up the various screens of user-interaction for completing a potential data entry task on a mobile interface. For the administrator desktop dashboard experience, we researched pre-existing effective dashboards and combined those established design elements with the interview data that we collected from the Denver Outbreak Team administrators.


6
User Testing & Revisions
We took these paper prototypes and conducted several user-testing sessions to gain feedback about the strengths and weaknesses of the overall user interaction. During these sessions, we gave the "mock- CDC users" specific tasks to complete within the mobile application and thus we were able to identify specific design elements and interaction-flows that were confusing and not intuitive to a new user. We then revised and refined our user-interaction design and created a digital interactive mockup on Adobe XD. This allowed for a higher-fidelity prototype to show the client and receive feedback.


7
Final Product
After doing a final round of user-testing and incorporating feedback into our design, we finalized our mobile application user-interface and user-experience. I primarily focused on designing and implementing this finalized UI design, while my team handled the back-end of the mobile application which consisted of linking buttons to appropriate actions and linking an external CDC database to store all the inputted information. Our final products were fully designed and developed iPhone and Android applications.

8
Future (web designs)
We handed the iOS/Swift and Android/Java code off to the CDC so that they could continue to tweak and change aspects of the mobile application that may need updating down the road. We also finalized our outbreak administrator dashboard design and the CDC will be working throughout 2019 to implement this dashboard-style interface for the administrator outbreak-management website. This redesign is a huge step forward in terms of data visualization and analysis for outbreak administrators. The CDC finalized the project with a statement of how the projected harmony of the mobile application and administrator dashboard will radically change outbreak analysis and response from here on out.


